
DXY (U.S. Dollar Index):
Potential Direction: Bearish
Overall momentum of the chart: Bearish
The price could see a short-term pullback toward the pivot before continuing its bearish move down toward the 1st support.
Pivot: 100.42
Supporting reasons: Identified as an overlap resistance, where previous price reactions suggest selling pressure could emerge. A bearish rejection from this area would strengthen the case for a move lower
1st support: 99.86
Supporting reasons: Identified as a pullback support and recent breakout area. If price reverses from the pivot, this level could provide the 1st area of support.
1st resistance: 101.11
Supporting reasons: Identified as a pullback resistance, where previous price action indicates potential selling pressure. This level would become more relevant if price breaks and closes convincingly above the pivot
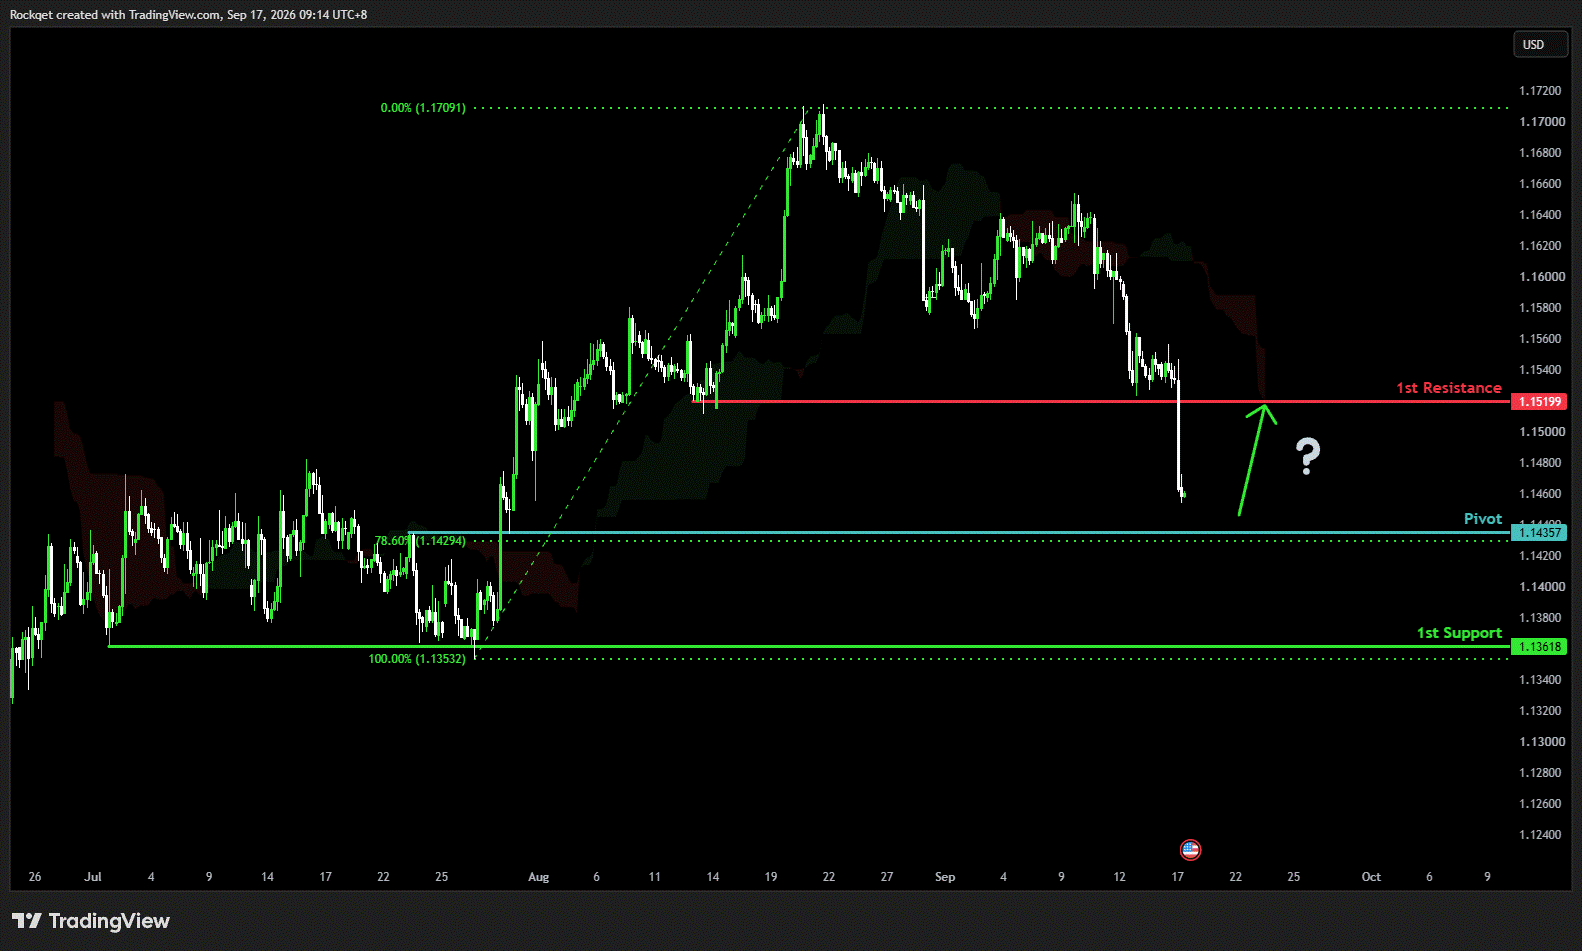
EUR/USD:
Potential Direction: Bullish
Overall momentum of the chart: Bullish
The price could see a short-term pullback before rebounding and continuing its bullish move toward the 1st resistance
Pivot: 1,1435
Supporting reasons: Identified as a pullback support and aligned closely with the 78.6% Fibonacci retracement. This confluence could provide an area where buying pressure re-emerges.
1st support: 1.14325
Supporting reasons: Identified as a swing low support, corresponding with the previous major low area where buying pressure emerged.
1st resistance: 1.1519
Supporting reasons: Identified as a pullback resistance where previous support and subsequent price reactions indicate potential selling pressure. This could cap an initial bullish recovery
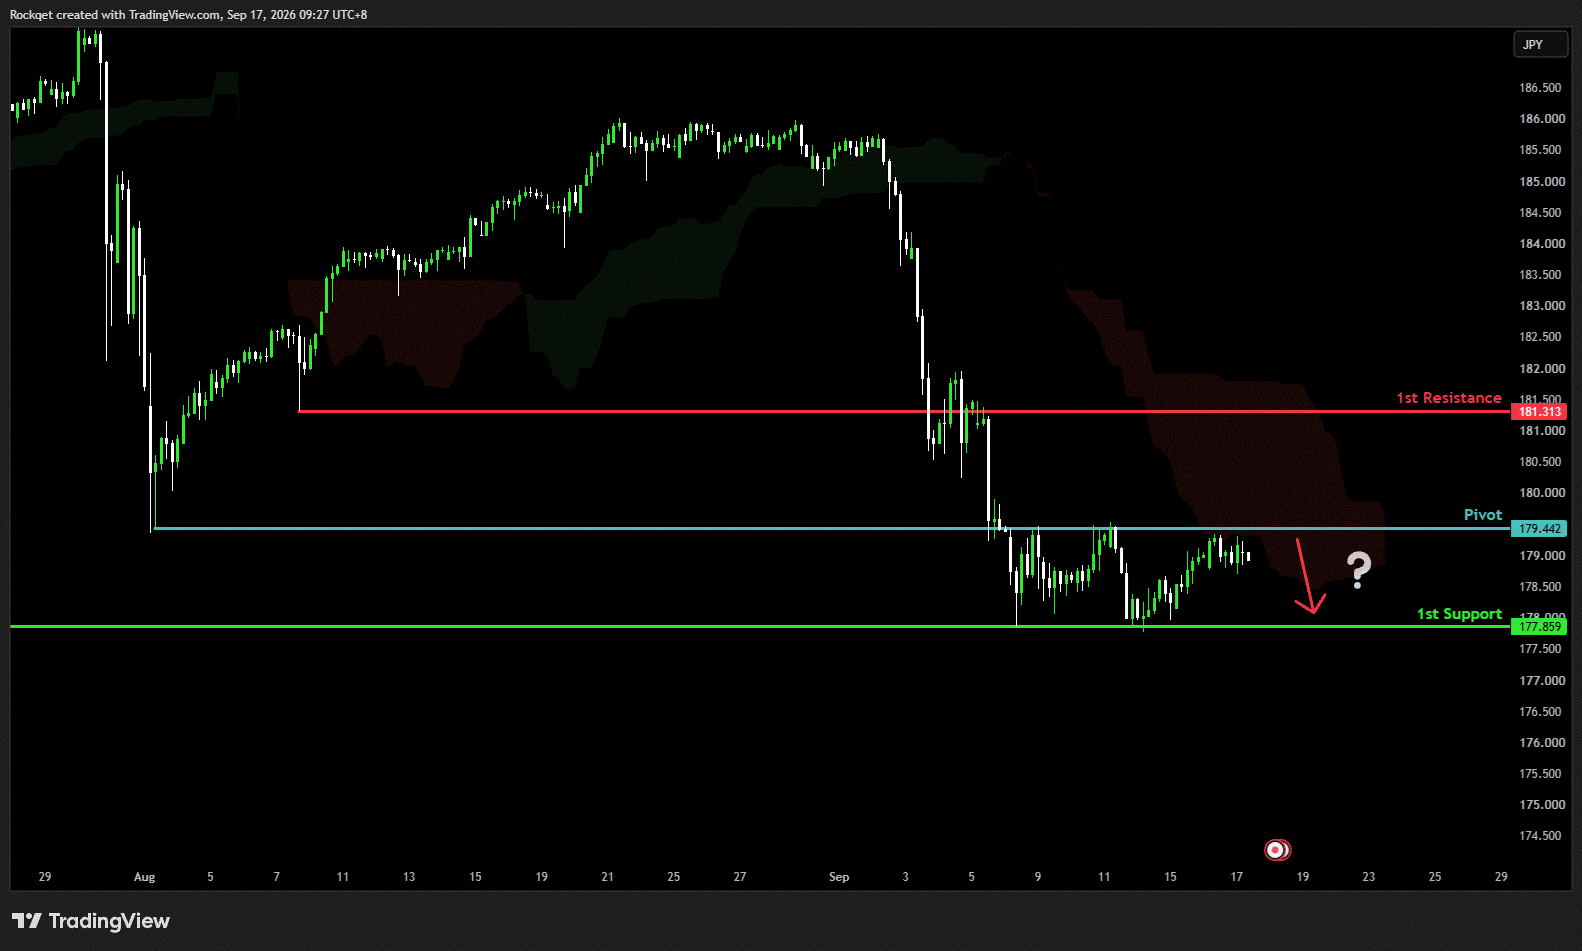
EUR/JPY:
Potential Direction: Bearish
Overall momentum of the chart: Bearish
The price has already reacted lower after testing resistance and could continue its bearish move toward the 1st support
Pivot: 179.44
Supporting reasons: Identified as an overlap resistance, where selling pressure could intensify and potentially cap any upward retracement
1st support: 175.39
Supporting reasons: Identified as a swing low support, where previous buying pressure emerged, and price could potentially stabilize again.
1st resistance: 181.31
Supporting reasons: Identified as an overlap resistance, where previous price reactions suggest selling pressure could emerge and potentially cap further upside.
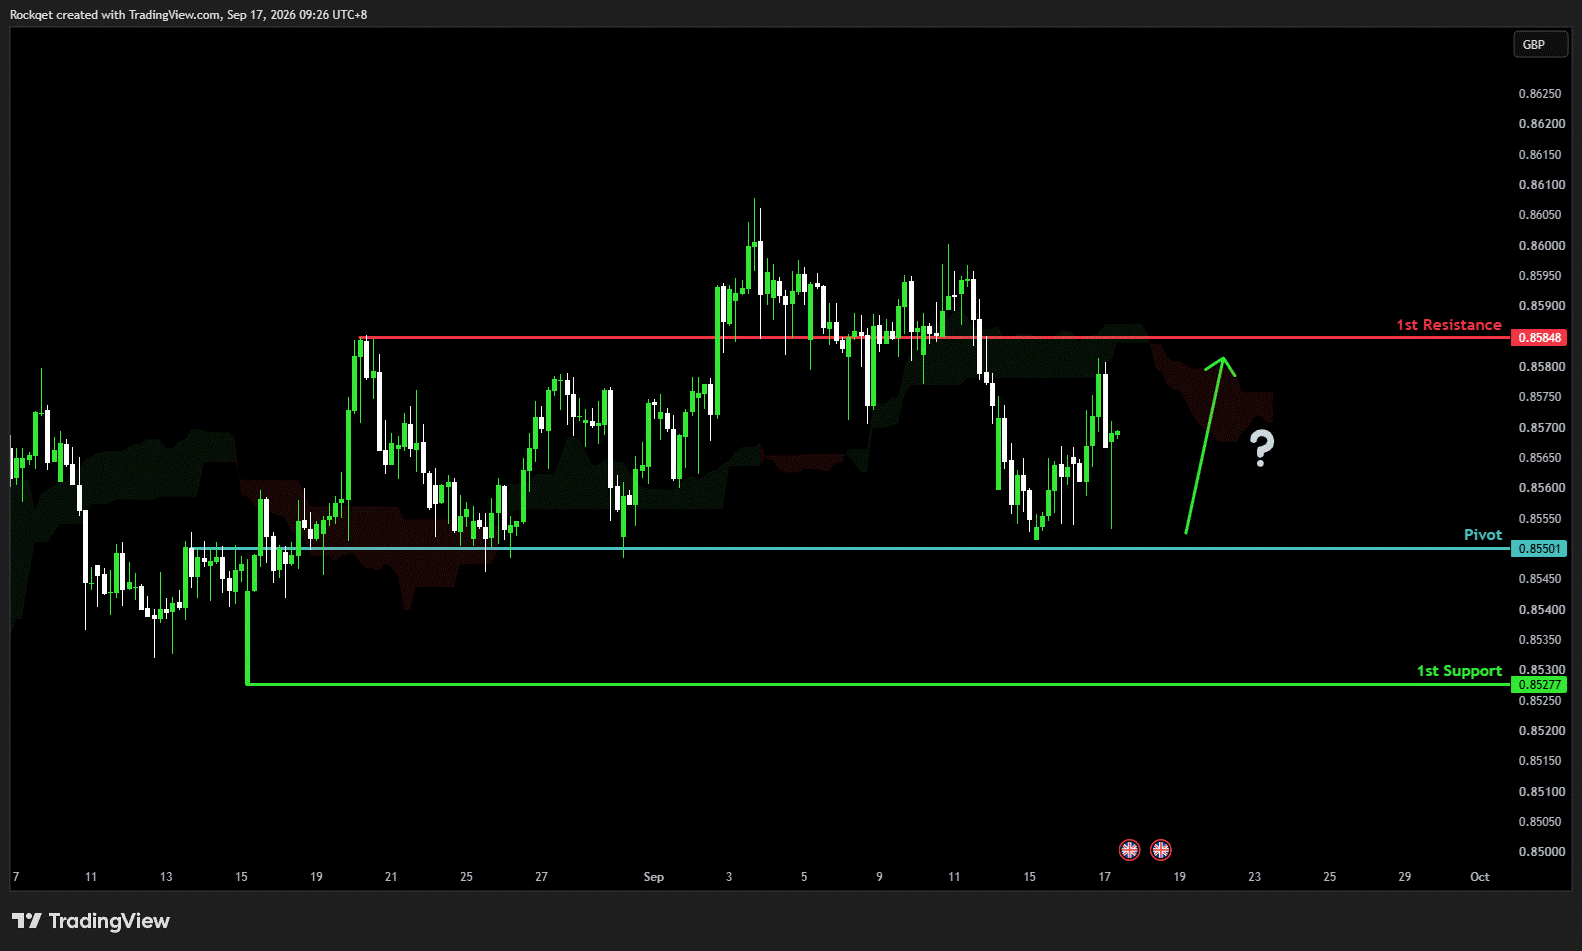
EUR/GBP:
Potential Direction: Bullish
Overall momentum of the chart: Bearish
The price could make a short-term pullback before rebounding and continuing its bullish move toward the 1st resistance
Pivot: 0.8550
Supporting reasons: Identified as an overlap support, where previous price reactions suggest renewed buying pressure could emerge and support a bullish recovery.
1st support: 0.8527
Supporting reasons: Identified as a swing-low support, marking a previous area of buying pressure where the price could potentially stabilize again.
1st resistance: 0.8584
Supporting reasons: Identified as a pullback resistance, where previous price reactions suggest selling pressure could emerge and potentially cap further upside
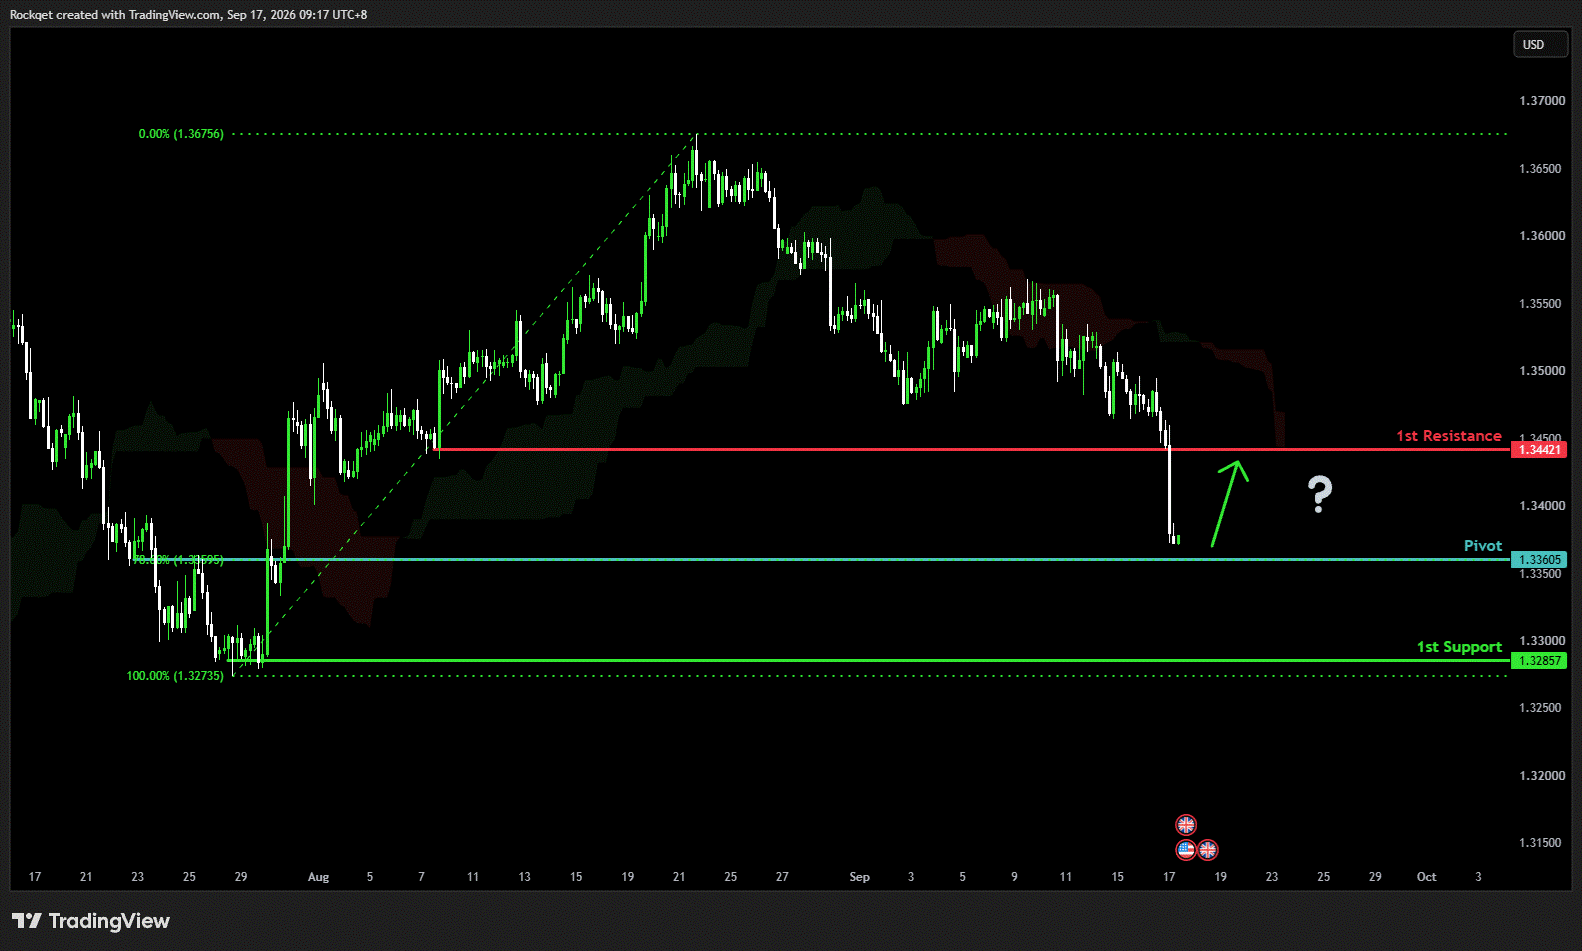
GBP/USD:
Potential Direction: Bullish
Overall momentum of the chart: Bullish
The price could rebound from the current area and make a short-term recovery toward the 1st resistance.
Pivot: 1.3360
Supporting reasons: Identified as a pullback support that aligns closely with the 78.6% Fibonacci retracement, indicating a potential area where renewed buying pressure could emerge.
1st support: 1.3285
Supporting reasons: Identified as a swing low support, representing a previous demand area where price could potentially stabilize if the decline extends.
1st resistance: 1.3442
Supporting reasons: Identified as a pullback resistance, where previous price reactions suggest selling pressure could emerge and potentially cap a bullish recovery
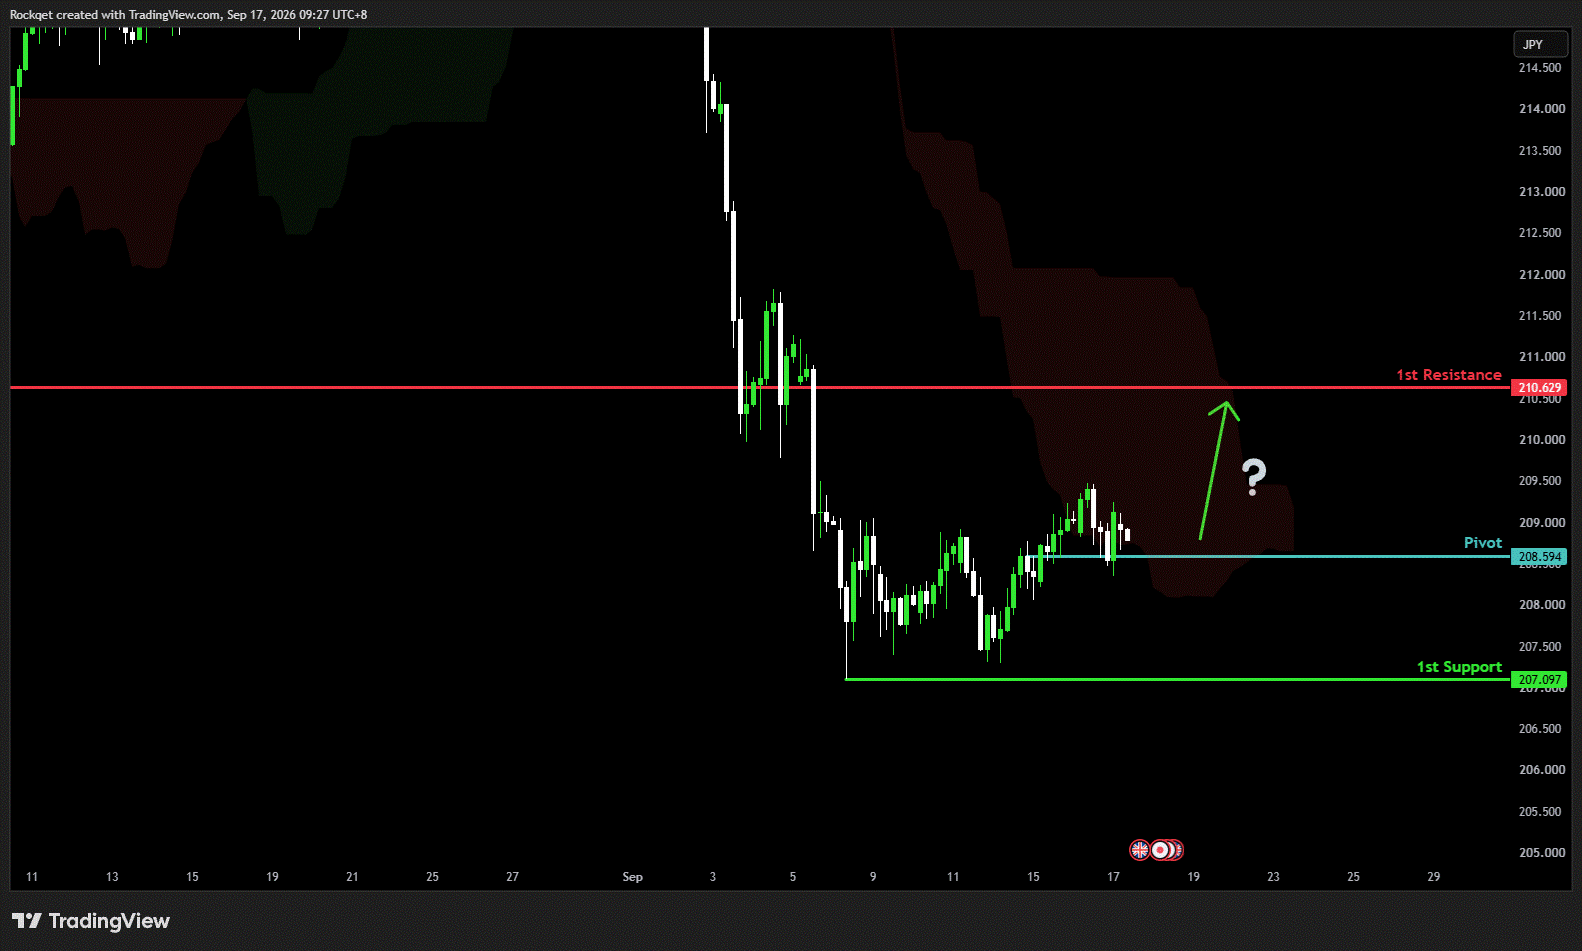
GBP/JPY:
Potential Direction: Bullish
Overall momentum of the chart: Bullish
The price has already bounced from the support area and could continue its short-term bullish recovery toward the 1st resistance
Pivot: 208.83
Supporting reasons: Identified as a pullback support, where renewed buying pressure could emerge to push the price higher.
1st support: 207.09
Supporting reasons: Identified as a swing low support, marking an area where previous buying pressure emerged and price could potentially stabilize again.
1st resistance: 210.62
Supporting reasons: Identified as a pullback resistance, where previous price reactions suggest selling pressure could emerge and potentially cap the bullish recovery.
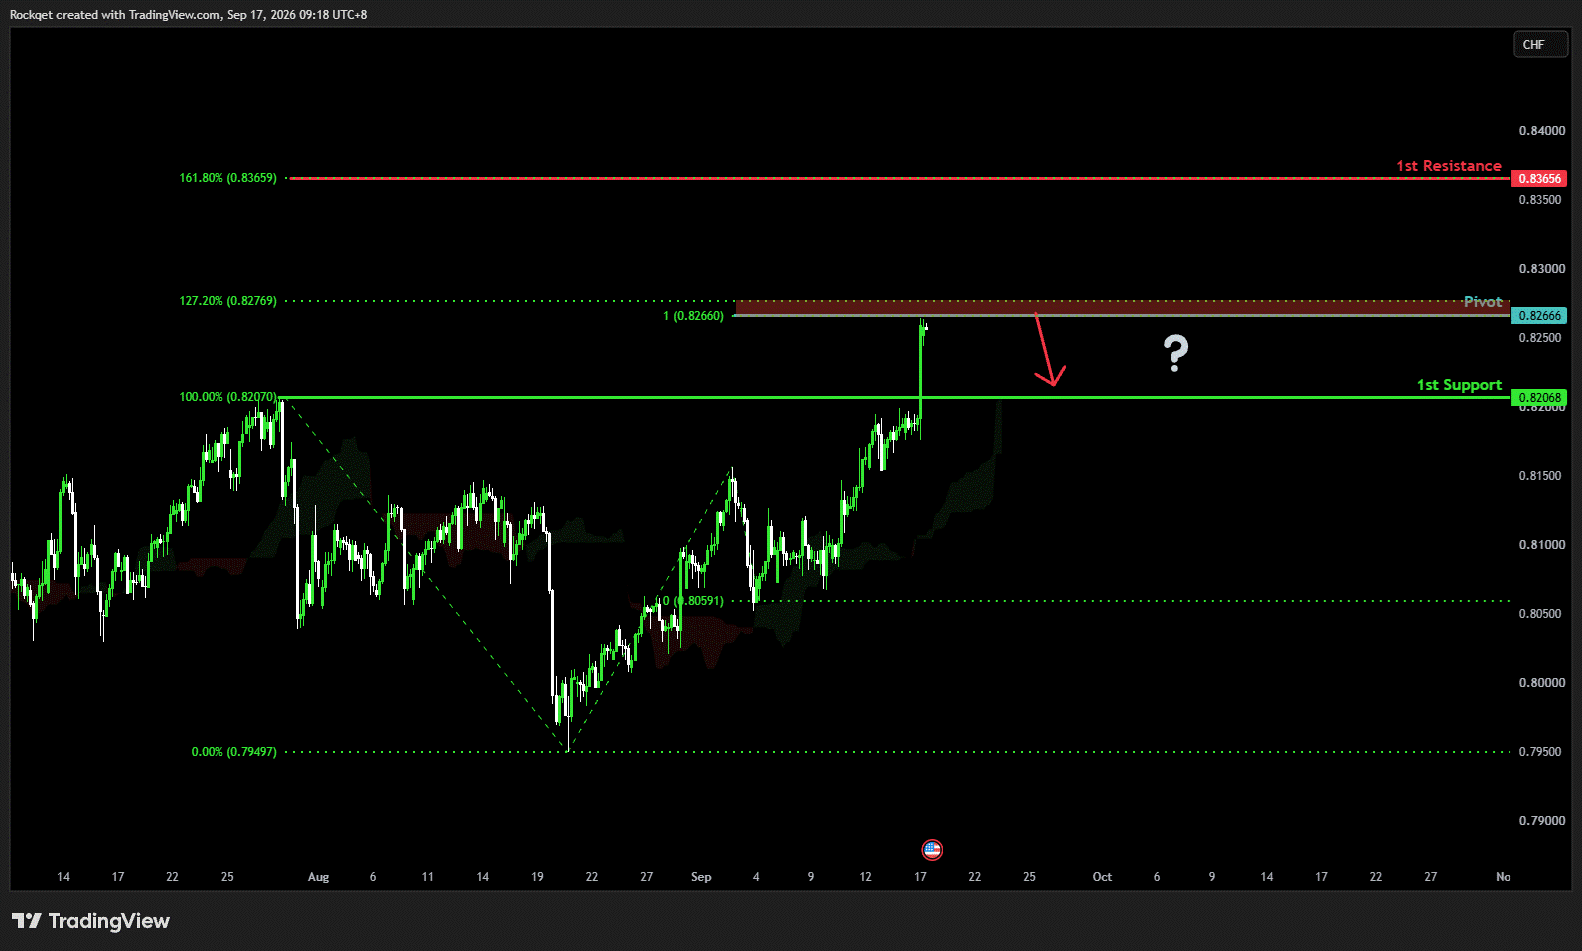
USD/CHF:
Potential Direction: Bearish
Overall momentum of the chart: Bearish
The price could face rejection from the pivot and make a short-term bearish move toward the 1st support
Pivot: 0.8266
Supporting reasons: Identified as a resistance that aligns closely with the 127.2% Fibonacci extension, where selling pressure could emerge and potentially trigger a bearish reversal
1st support: 0.8206
Supporting reasons: Identified as a pullback support, and previous swing-high area, where renewed buying pressure could emerge and potentially stabilize the price. ndicating a potential level where the price could stabilize once again.
1st resistance: 0.8365
Supporting reasons: Identified as an extension resistance that aligns closely with the 161.8% Fibonacci extension, indicating a potential upside barrier if price breaks above the pivot.
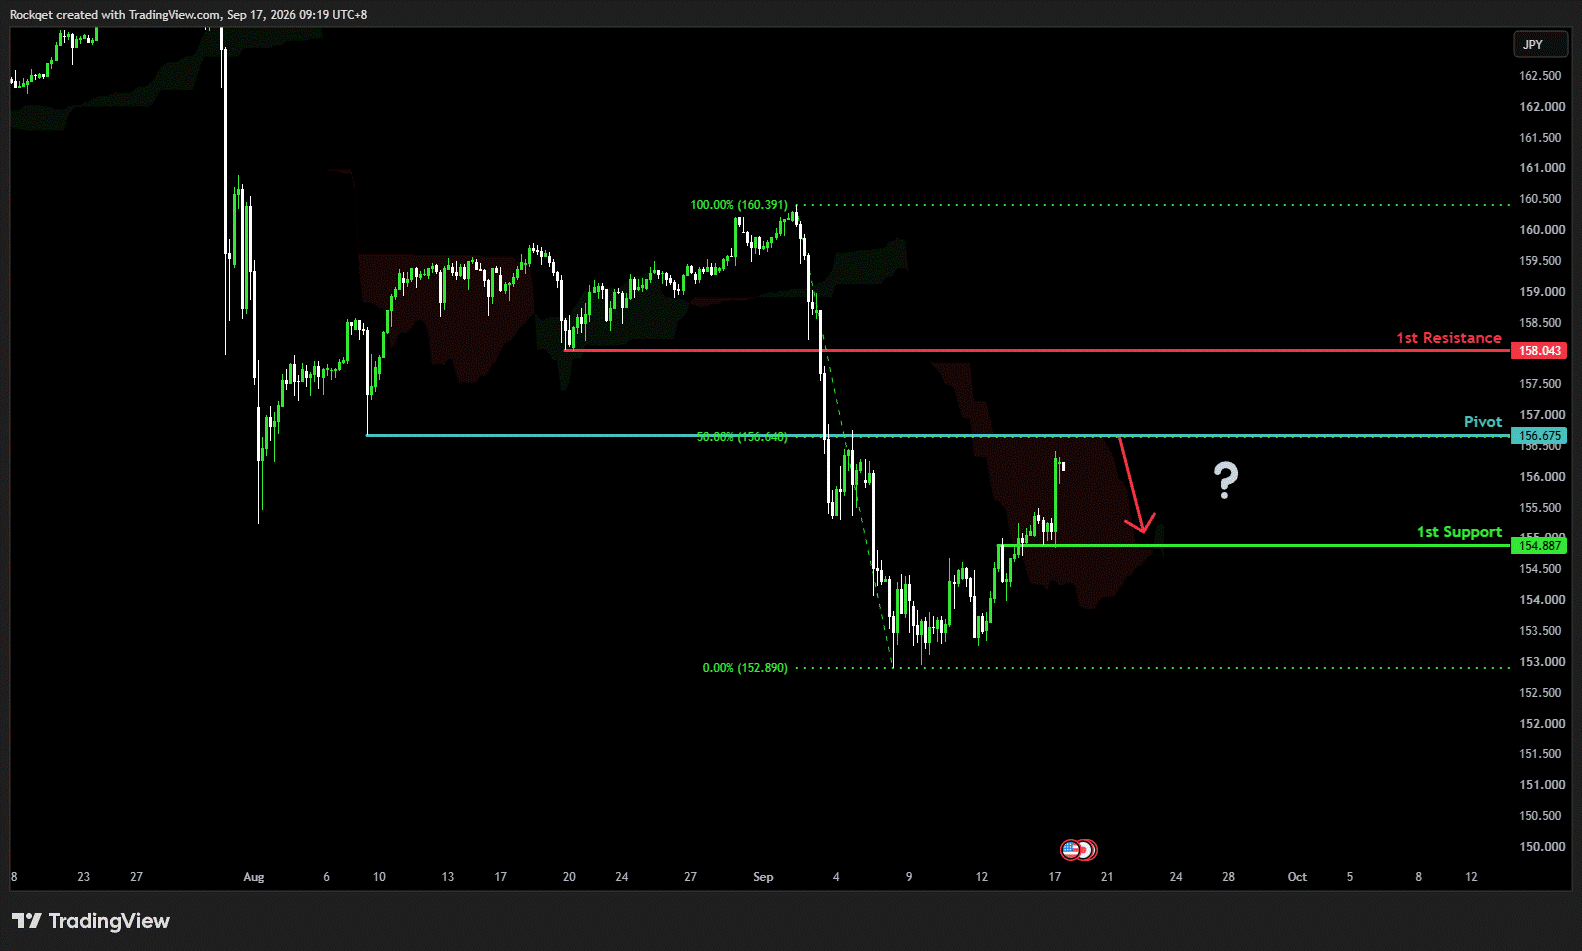
USD/JPY:
Potential Direction: Bearish
Overall momentum of the chart: Bullish
The price could see a short-term pullback to the pivot before reversing lower and continuing its bearish move toward the 1st support.
Pivot: 156.67
Supporting reasons: Identified as an overlap support that aligns closely with the 50% Fibonacci retracement, where selling pressure could emerge and potentially cap the short-term recovery
1st support: 154.88
Supporting reasons: Identified as an overlap support, marking a recent reaction area where buying pressure could emerge and potentially stabilize the price.
1st resistance: 158.04
Supporting reasons: Identified as an overlap resistance where previous price reactions indicate potential selling pressure that could cap further upward movement.
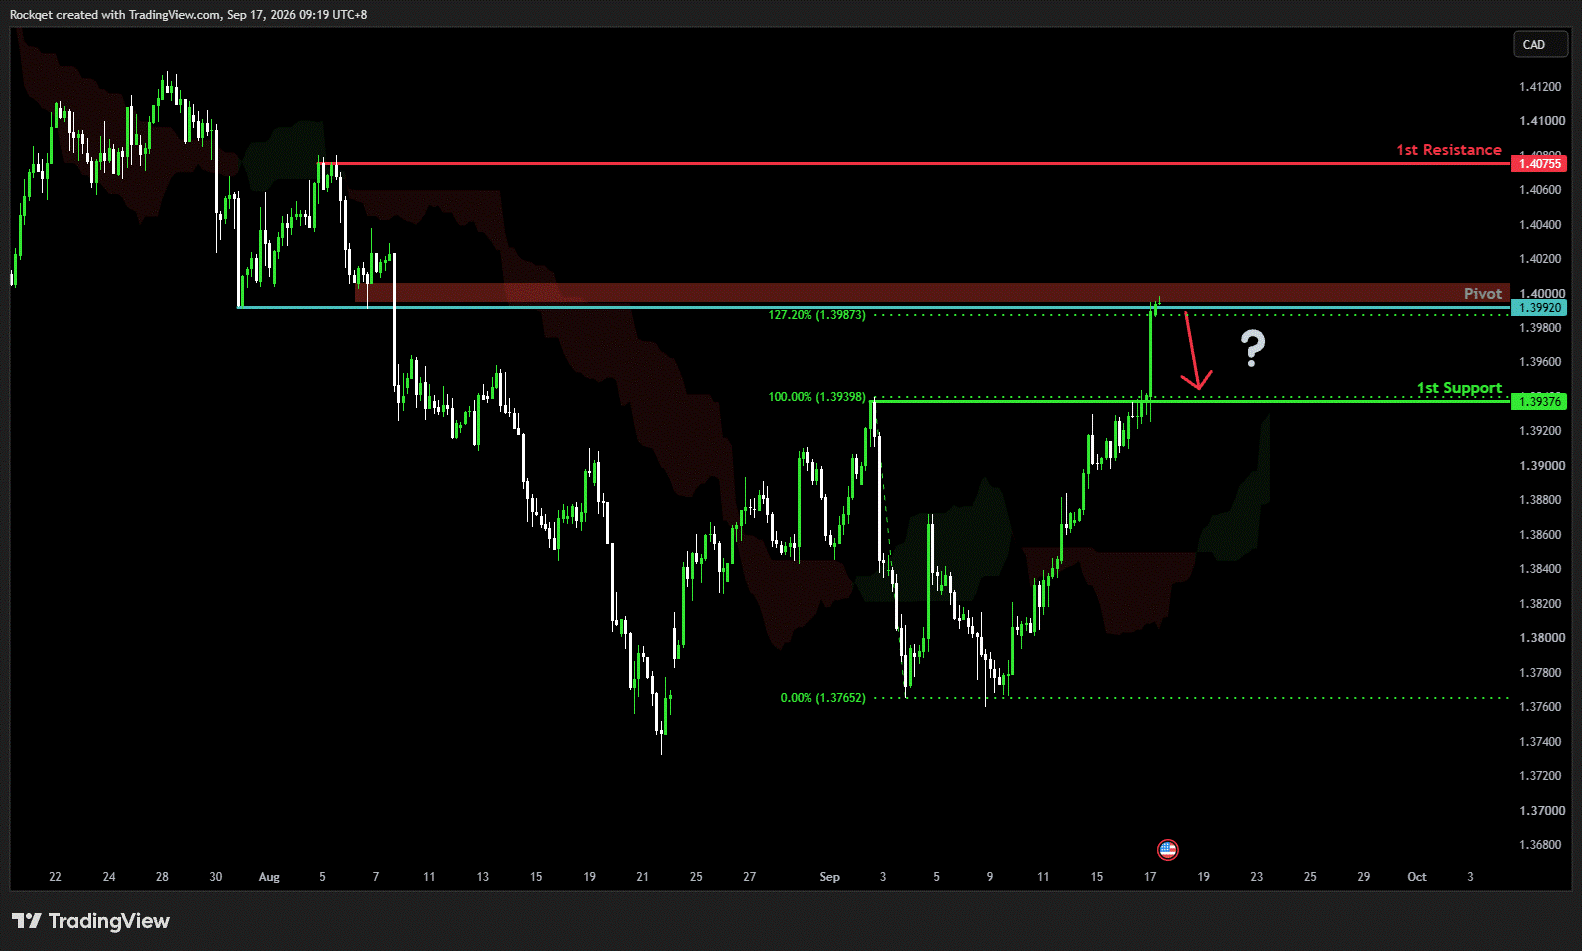
USD/CAD:
Potential Direction: Bearish
Overall momentum of the chart: Bearish
The price could face rejection from the pivot and make a short-term bearish move toward the 1st support
Pivot: 1.3992
Supporting reasons: Identified as a pullback resistance that aligns closely with the 127.2% Fibonacci extension, where selling pressure could emerge and potentially trigger a bearish reversal.
1st support: 1.3937
Supporting reasons: Identified as a a pullback support that aligns closely with the previous swing-high area, where buying pressure could emerge and potentially stabilize the price.
1st resistance: 1.4075
Supporting reasons: Identified as a swing high resistance marking a previous area of strong selling pressure that could potentially cap further upside.
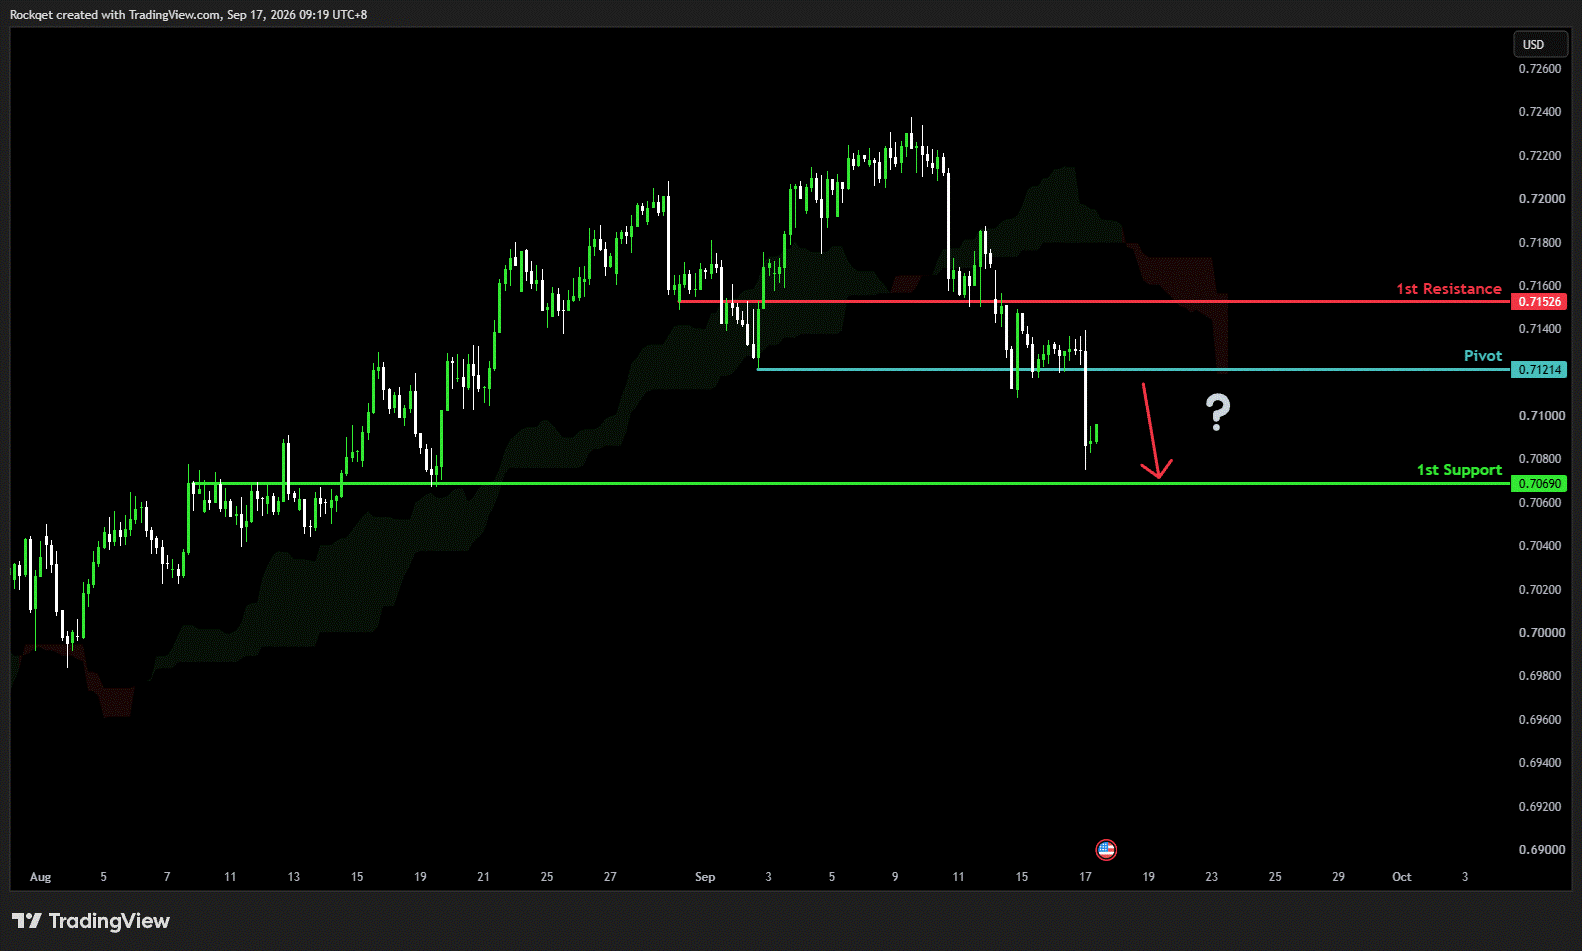
AUD/USD:
Potential Direction: Bearish
Overall momentum of the chart: Bullish
The price could see a short-term recovery before reversing lower and continuing its bearish move toward the 1st support.
Pivot: 0.7121
Supporting reasons: Identified as an overlap resistance, where selling pressure could intensify and potentially cap any upward retracement
1st support: 0.7069
Supporting reasons: Identified as a pullback support, where previous price reactions suggest selling pressure could emerge and potentially cap any upward retracement.
1st resistance: 0.7152
Supporting reasons: Identified as a pullback resistance, indicating a potential area that could halt any further upward movement.
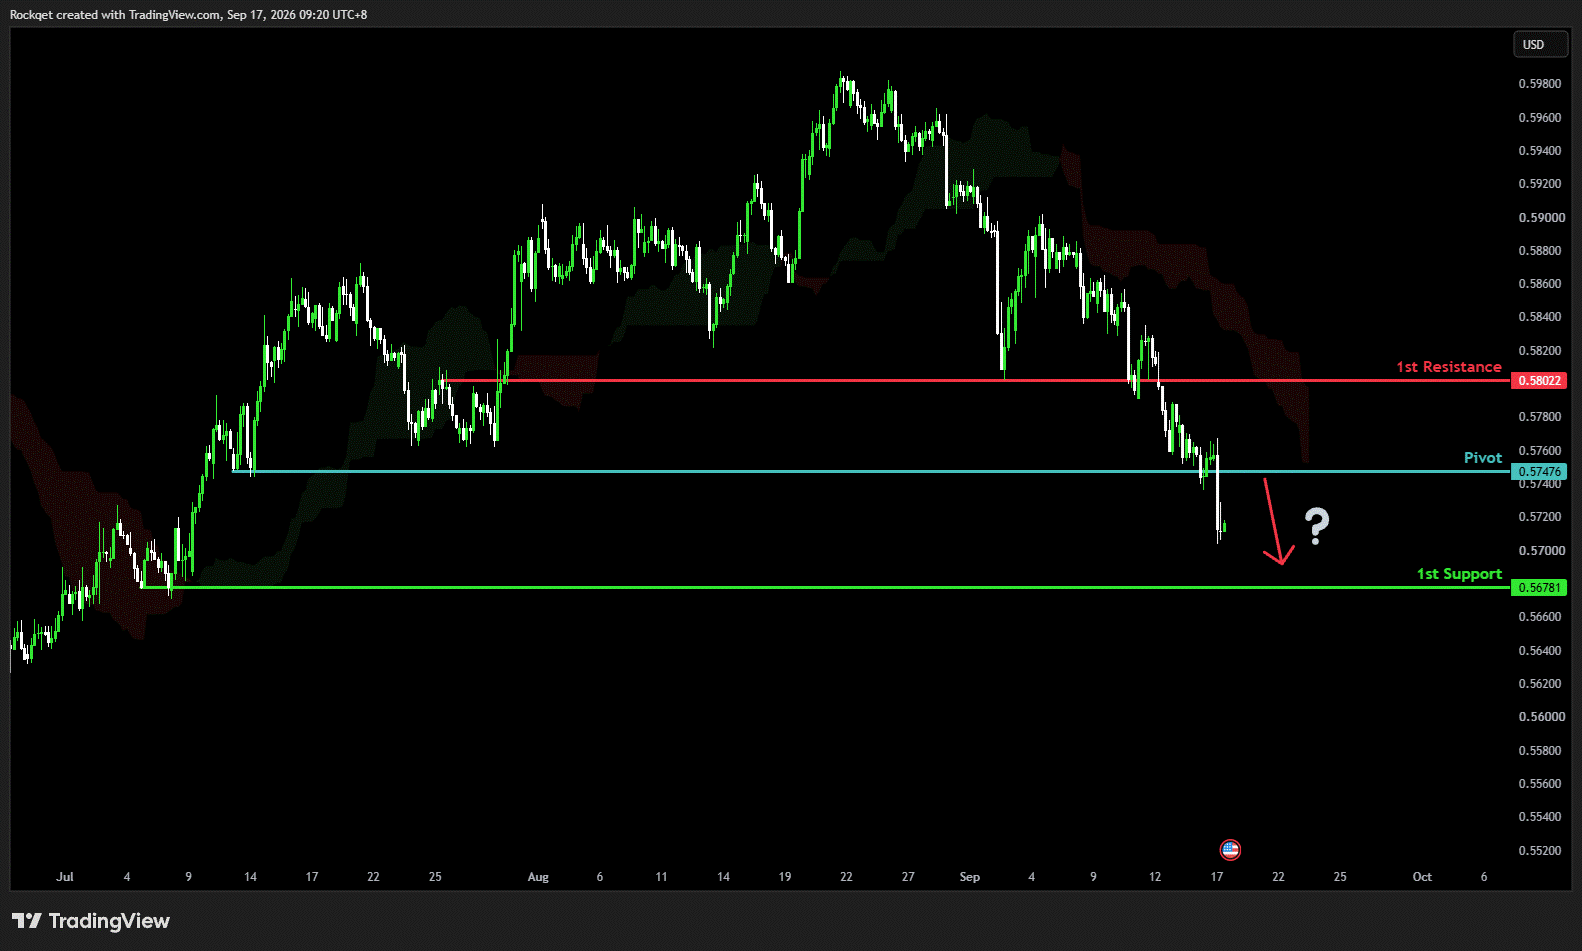
NZD/USD
Potential Direction: Bearish
Overall momentum of the chart: Bullish
The price could see a short-term recovery before reversing lower and continuing its bearish move toward the 1st support.
Pivot: 0.5747
Supporting reasons: Identified as a pullback resistance, where selling pressure could intensify and potentially cap any upward retracement
1st support: 0.5678
Supporting reasons: Identified as a swing low support, where previous price reactions suggest selling pressure could emerge and potentially cap any upward retracement.
1st resistance: 0.5802
Supporting reasons: Identified as a pullback resistance, where previous price reactions indicate potential selling pressure that could cap further upward movement.
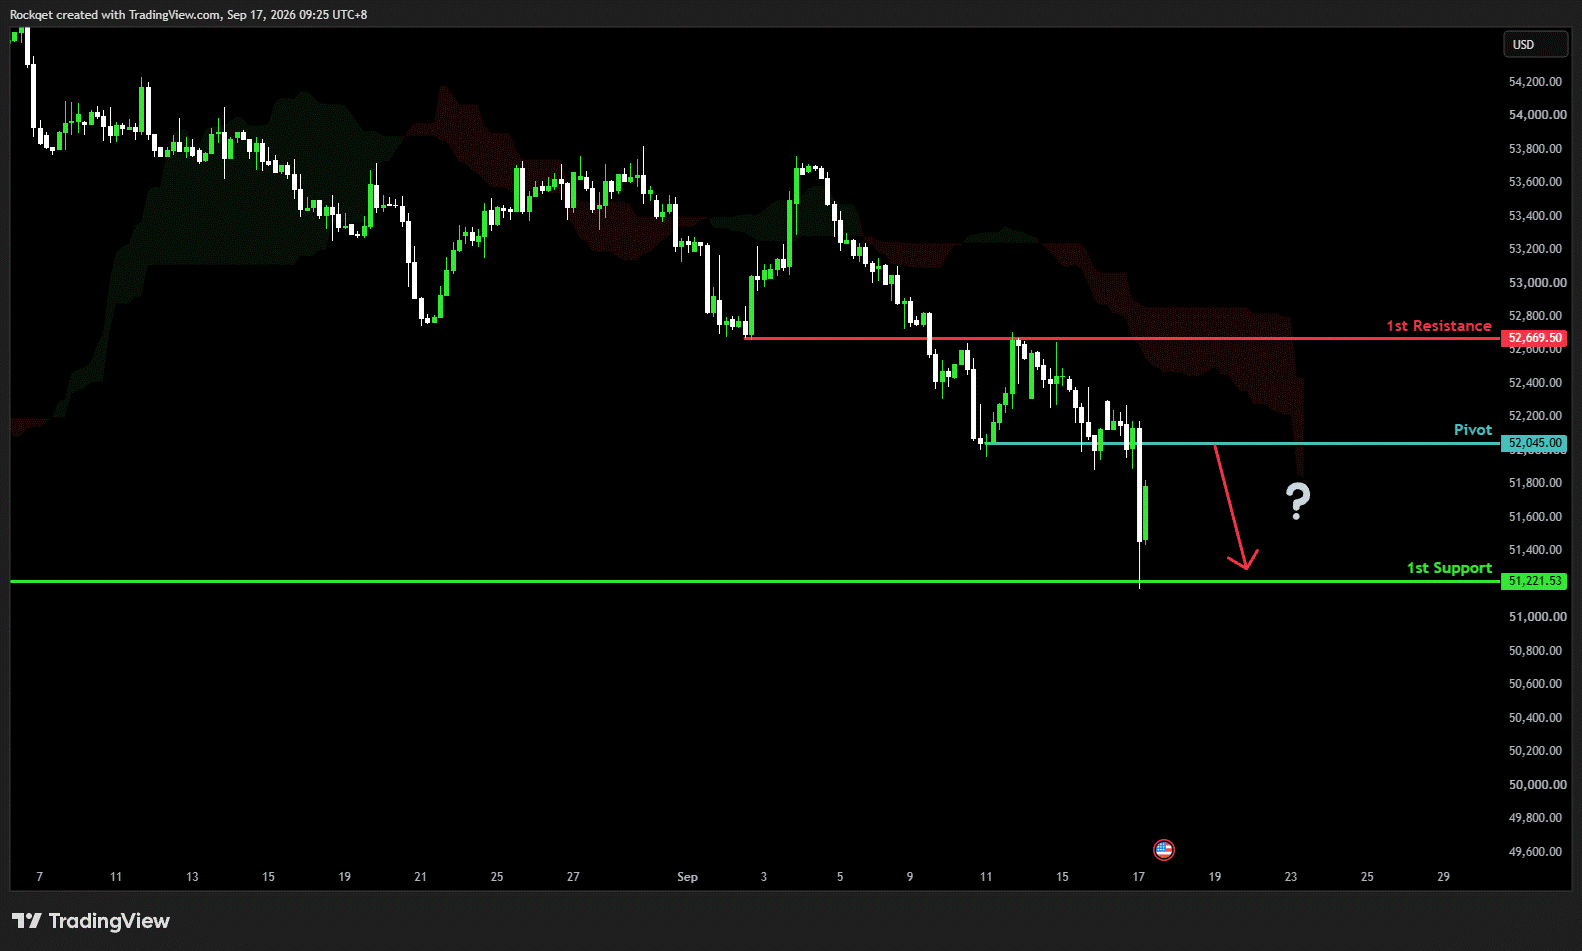
US30 (DJIA):
Potential Direction: Bearish
Overall momentum of the chart: Bullish
The price could see a short-term recovery before reversing lower and continuing its bearish move toward the 1st support.
Pivot: 52,045.00
Supporting reasons: Identified as an overlap resistance, where selling pressure could intensify and potentially cap any upward retracement
1st support: 51,221.53
Supporting reasons: Identified as a swing low support, where previous price reactions suggest selling pressure could emerge and potentially cap any upward retracement.
1st resistance: 52,669.50
Supporting reasons: Identified as an overlap resistance, indicating a potential area that could halt any further upward movement.
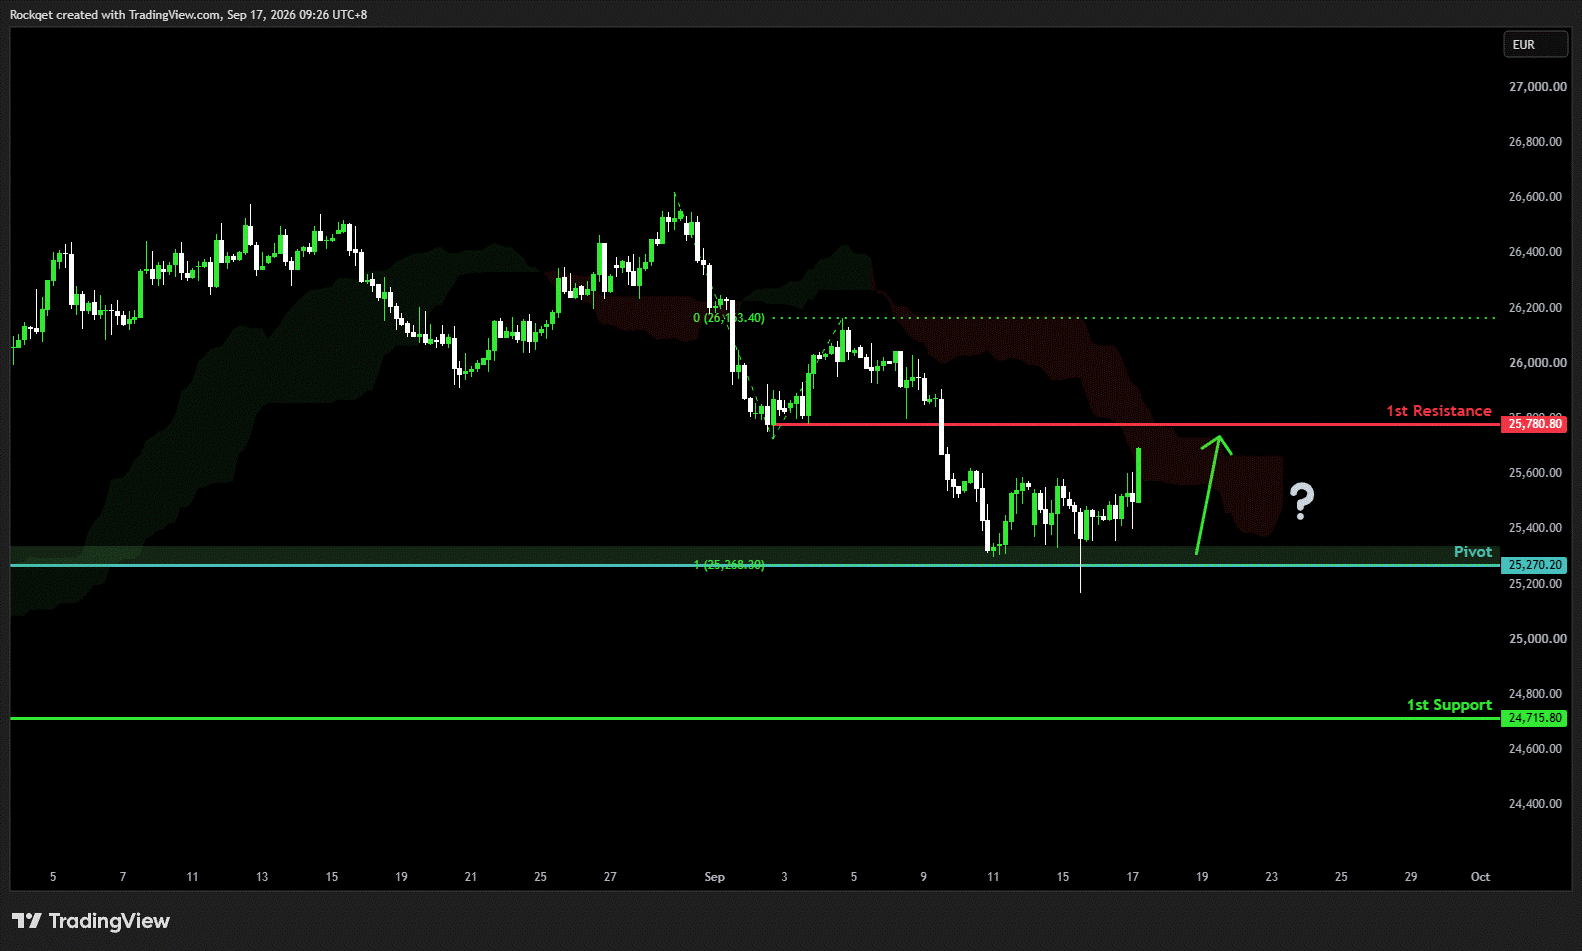
DE40 (DAX):
Potential Direction: Bullish
Overall momentum of the chart: Bullish
The price has already bounced from the pivot and could continue its short-term bullish recovery toward the 1st resistance.
Pivot: 25,270.20
Supporting reasons: Identified as a pullback support that aligns with the 100% Fibonacci retracement, where renewed buying pressure could emerge and support further upside.
1st support: 24,715.80
Supporting reasons: Identified as a swing low support, marking a key area where buying pressure could emerge and potentially stabilize the price if the decline resumes
1st resistance: 25,780.80
Supporting reasons: Identified as a pullback resistance, where previous price reactions suggest selling pressure could emerge and potentially cap the short-term bullish recovery.
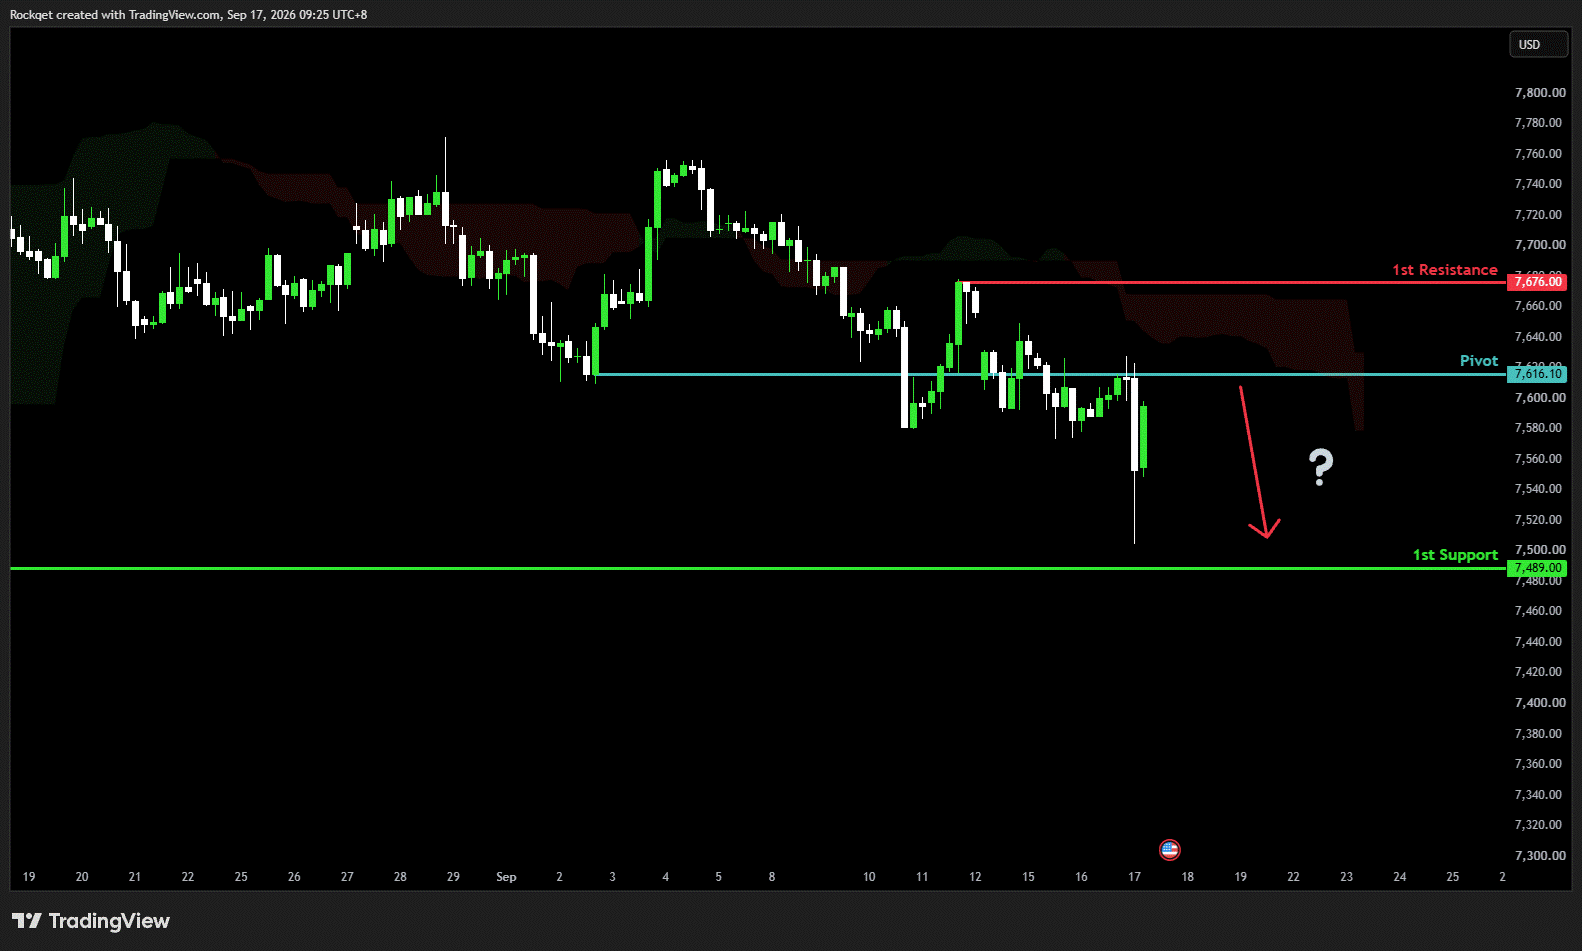
US500 (S&P 500):
Potential Direction: Bearish
Overall momentum of the chart: Bullish
The price could see a short-term recovery before reversing lower and continuing its bearish move toward the 1st support.
Pivot: 7,616.10
Supporting reasons: Identified as an overlap resistance, where previous price reactions suggest selling pressure could emerge and potentially cap any upward retracement.
1st support: 7,489.00
Supporting reasons: Identified as a pullback support, marking a key area where buying pressure could emerge and potentially stabilize the price.
1st resistance: 7,676.00
Supporting reasons: Identified as a swing high resistance, indicating a potential area that could halt any further upward movement.
\
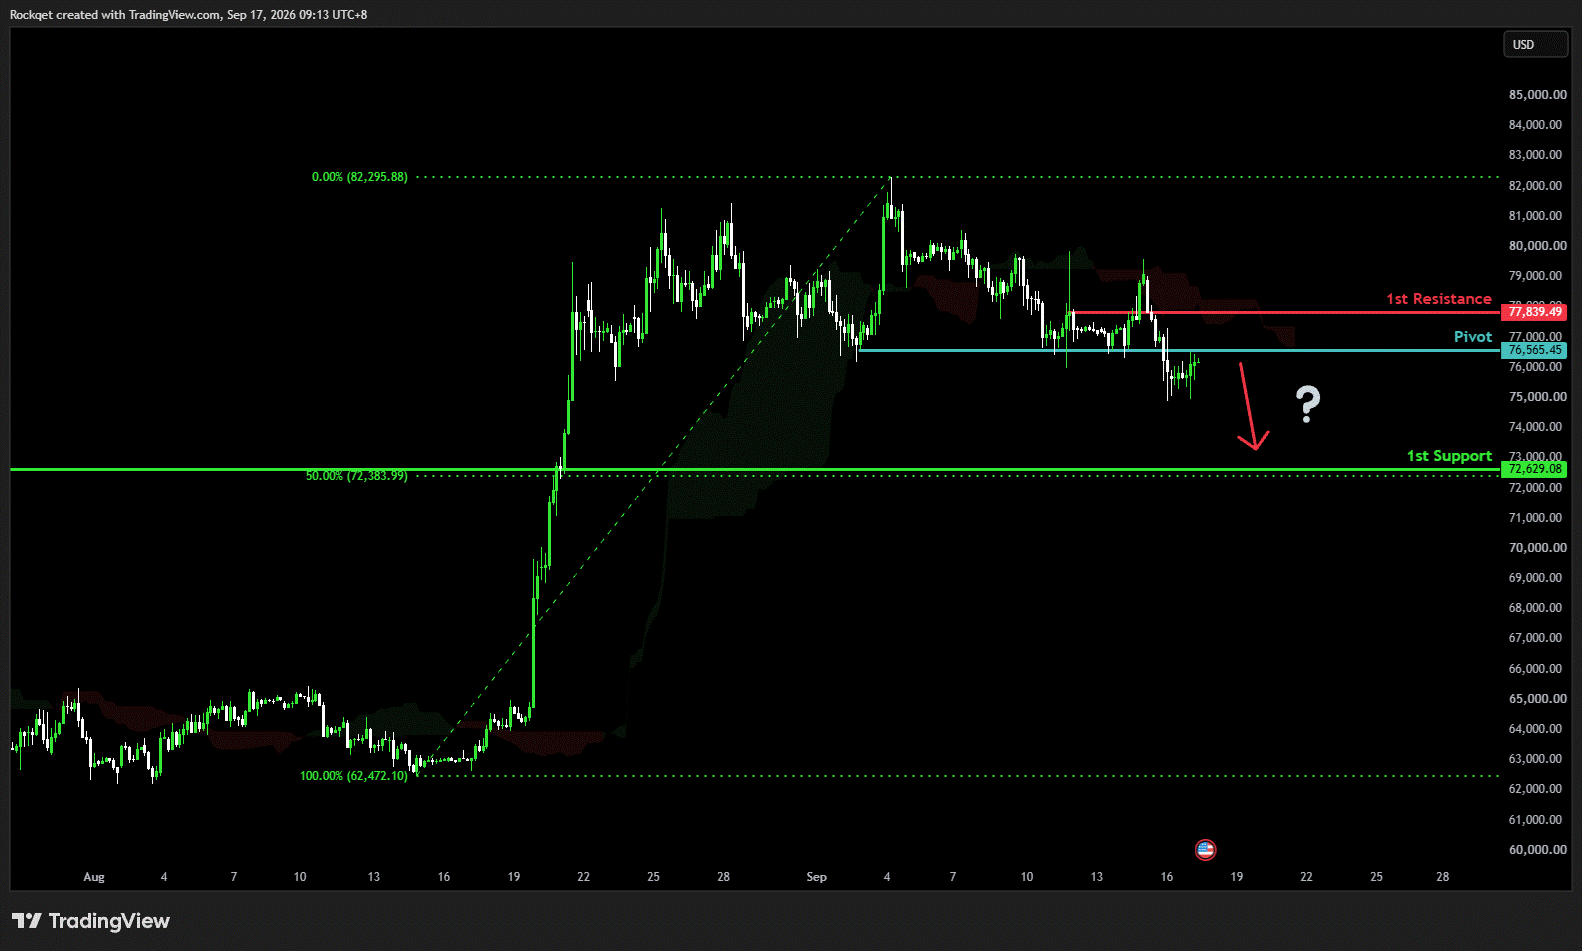
BTC/USD (Bitcoin):
Potential Direction: Bearish
Overall momentum of the chart: Bullish
The price could see a short-term recovery before reversing lower and continuing its bearish move toward the 1st support.
Pivot: 76.565.45
Supporting reasons: Identified as a pullback resistance, where previous price reactions suggest selling pressure could emerge and potentially cap any upward retracement.
1st support: 72,629.08
Supporting reasons: Identified as a pullback support with additional confluence from the nearby 50% Fibonacci retracement, indicating a potential area where price could stabilize.
1st resistance: 77,839.49
Supporting reasons: Identified as a pullback resistance, where previous price reactions suggest selling pressure could emerge and potentially cap further upward movement.
\
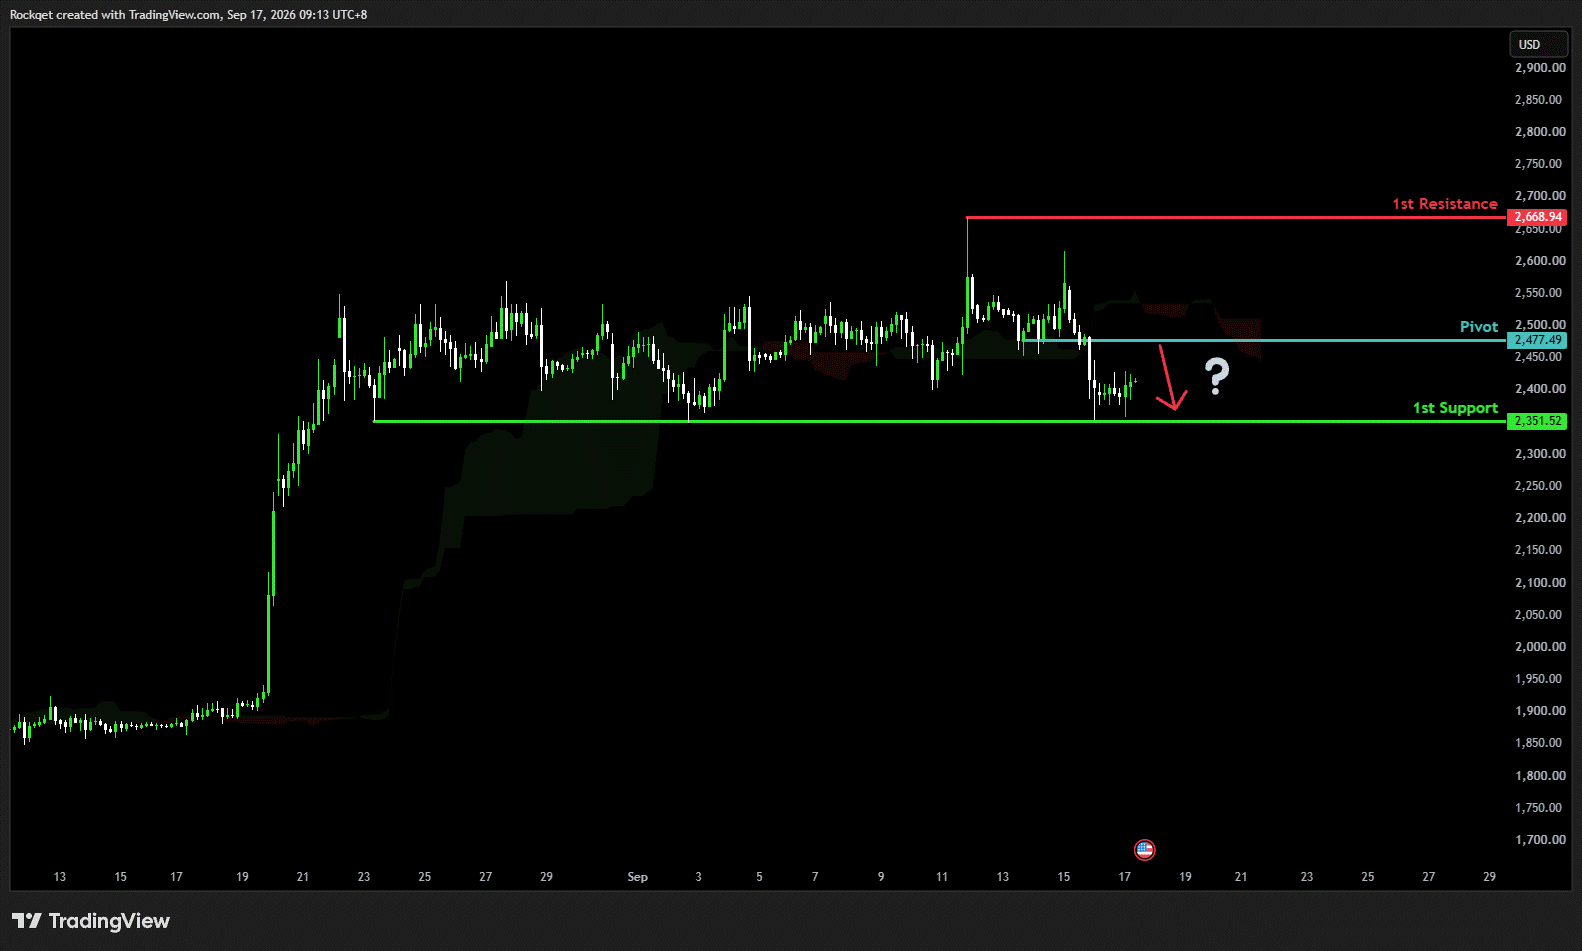
ETH/USD (Ethereum):
Potential Direction: Bearish
Overall momentum of the chart: Bullish
The price could see a short-term pullback toward the pivot before continuing its bearish move down toward the 1st support.
Pivot: 2,477.49
Supporting reasons: Identified as a pullback resistance, where selling pressure could intensify and potentially cap any upward retracement
1st support: 2,351.52
Supporting reasons: Identified as a swing low support, indicating a potential level where the price could stabilize once more.
1st resistance: 2,668.94
Supporting reasons: Identified as a swing high resistance, indicating a potential area that could halt any further upward movement.
WTI/USD (Oil):
Potential Direction: Bullish
Overall momentum of the chart: Bullish
The price could make a short-term pullback toward the pivot before rising again toward the 1st resistance.
Pivot: 98.73
Supporting reasons: Identified as an overlap support, where renewed buying pressure could emerge to push the price higher.
1st support: 93.72
Supporting reasons: Identified as an overlap support, indicating a key level where the price could stabilize once more.
1st resistance: 108.11
Supporting reasons: Identified as a swing high resistance that aligns with the 200% Fibonacci projection, indicating a potential area that could halt any further upward movement.
\
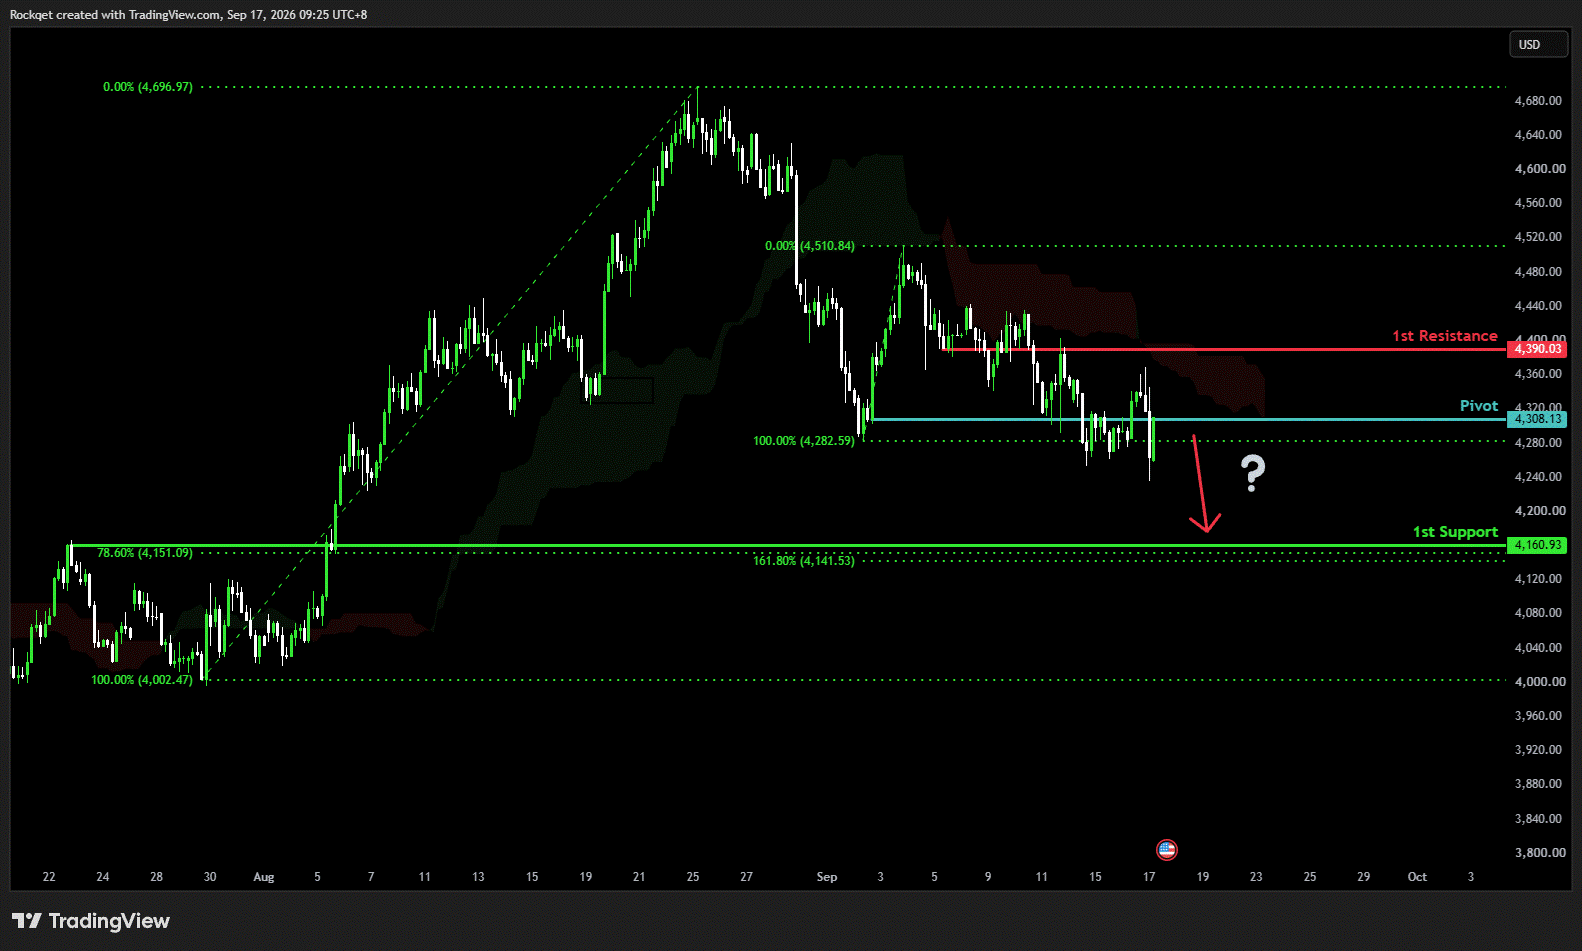
XAU/USD (GOLD):
Potential Direction: Bearish
Overall momentum of the chart: Bullish
The price has already reacted off the pivot and may continue its bearish move toward the 1st support.
Pivot: 4,308.13
Supporting reasons: Identified as a pullback resistance, where selling pressure could intensify and potentially cap any upward retracement
1st support: 4,160.93
Supporting reasons: Identified as a pullback support that aligns with the 161.8% Fibonacci extension, indicating a key level where the price could stabilize once more.
1st resistance: 4,390.03
Supporting reasons: Identified as a pullback resistance, indicating a potential area that could halt any further upward movement.
The accuracy, completeness and timeliness of the information contained on this site cannot be guaranteed. IC Markets does not warranty, guarantee or make any representations, or assume any liability regarding financial results based on the use of the information in the site.
News, views, opinions, recommendations and other information obtained from sources outside of www.icmarkets.com.au, used in this site are believed to be reliable, but we cannot guarantee their accuracy or completeness. All such information is subject to change at any time without notice. IC Markets assumes no responsibility for the content of any linked site.
The fact that such links may exist does not indicate approval or endorsement of any material contained on any linked site. IC Markets is not liable for any harm caused by the transmission, through accessing the services or information on this site, of a computer virus, or other computer code or programming device that might be used to access, delete, damage, disable, disrupt or otherwise impede in any manner, the operation of the site or of any user’s software, hardware, data or property.